Climate calculations for companies
With over 20 years of experience in climate change assessments, we know that sustainability managers have a lot on their shoulders. ZeroMission therefore offers support that is not only technical, but also strategic. Our climate strategists help guide the work when needed, organize follow-ups and create Q&A sessions with relevant reporters to ensure the right support and a reliable result. With the Our Impacts Sustainability Platform , you can focus on concrete actions.
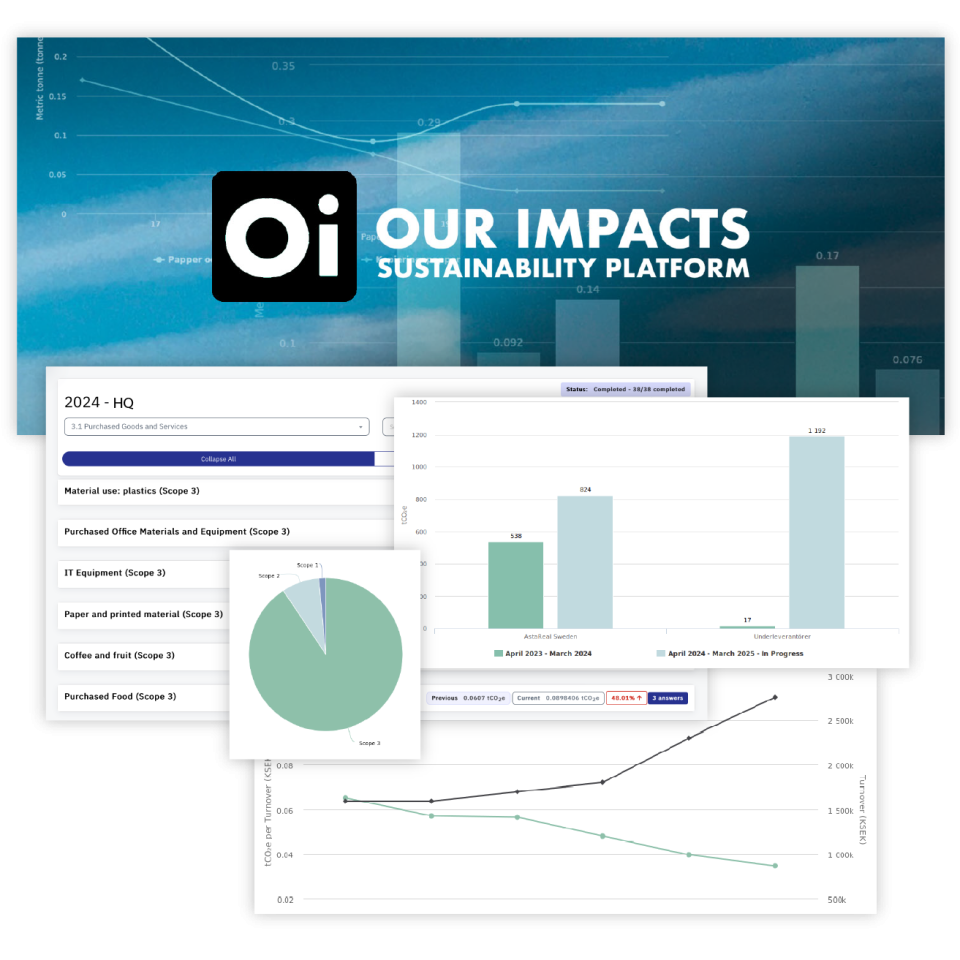
Our Impacts - climate calculations in a user-friendly sustainability platform
Our Impacts Sustainability Platform youSustainability Platform a comprehensive tool for climate calculations and sustainability reporting, making it easy for large and small organizations to structure their work and quickly calculate their climate impact. The platform provides you with clear insights, support for reducing emissions, and documentation for reports.
The platform is developed for third-party verification and, with its CSRD, is ready to handle all reporting in accordance with ESRS.


2026
With 20 years of experience, ZeroMission has ZeroMission and expertise to help you measure, understand, and reduce your climate footprint, as well as set strategies such as Climate Transition Plans (CTP) or Science Based Targets SBTi).
Time and location specific climate calculations
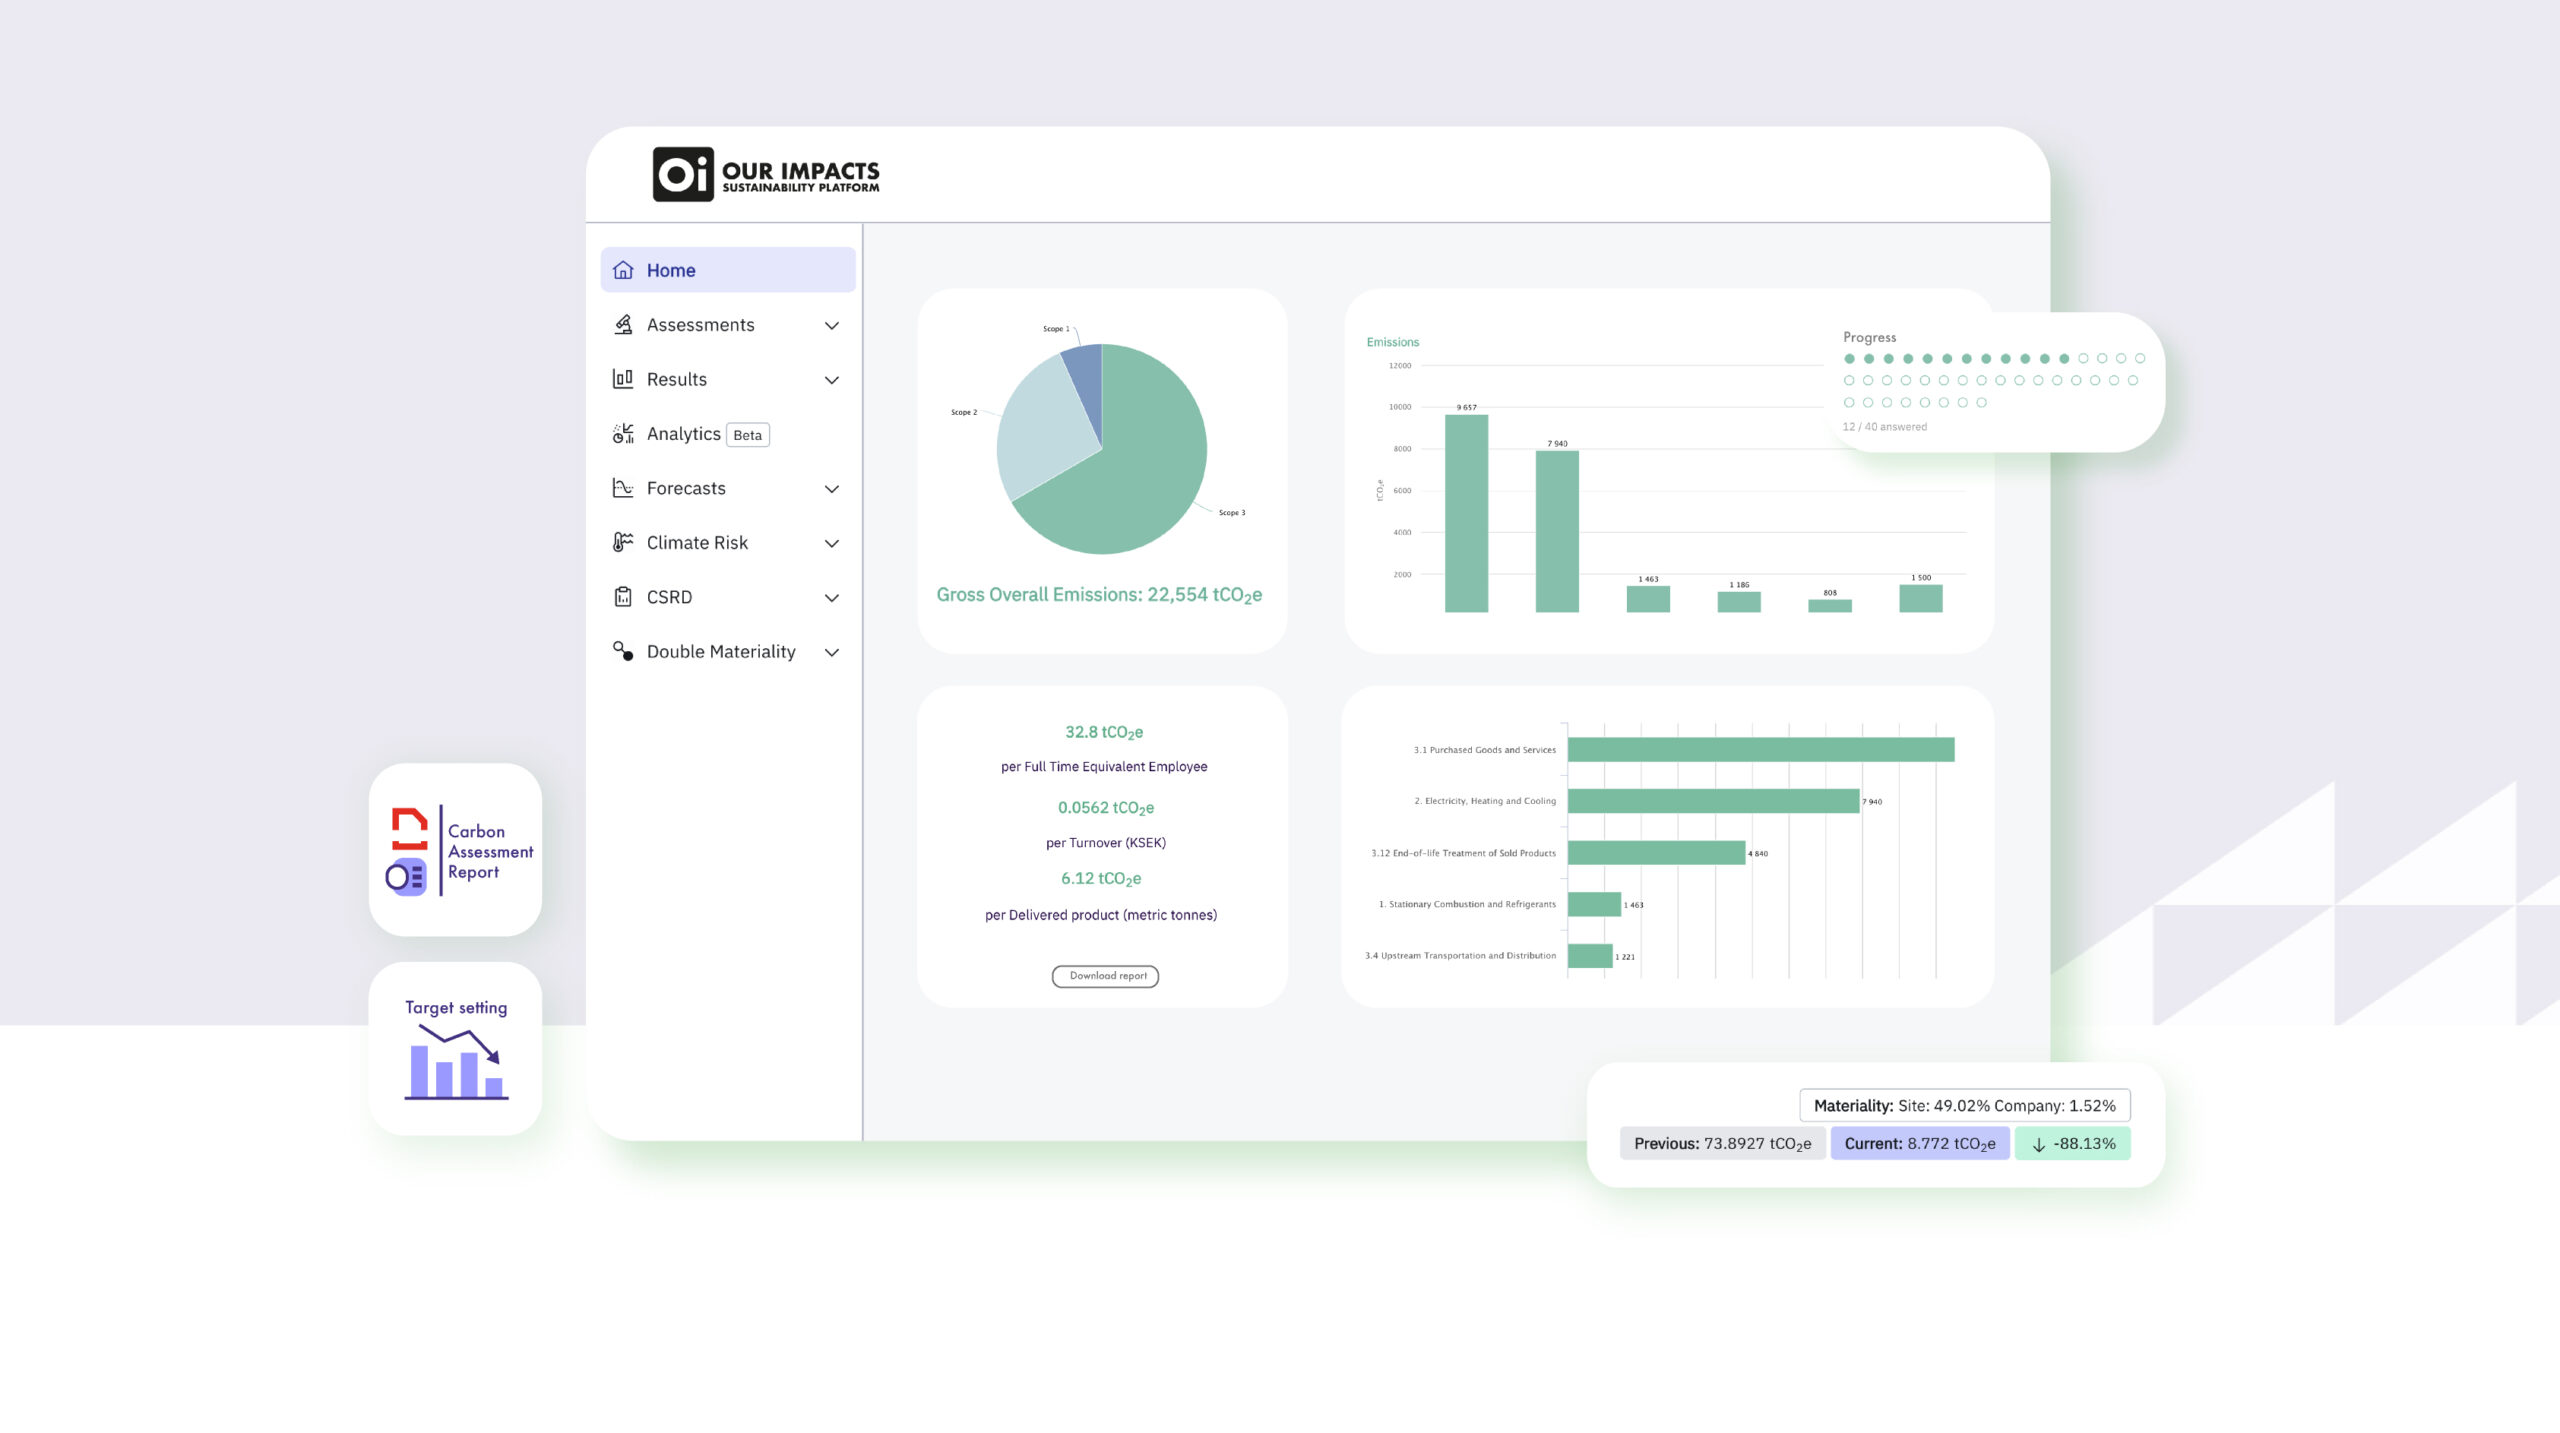
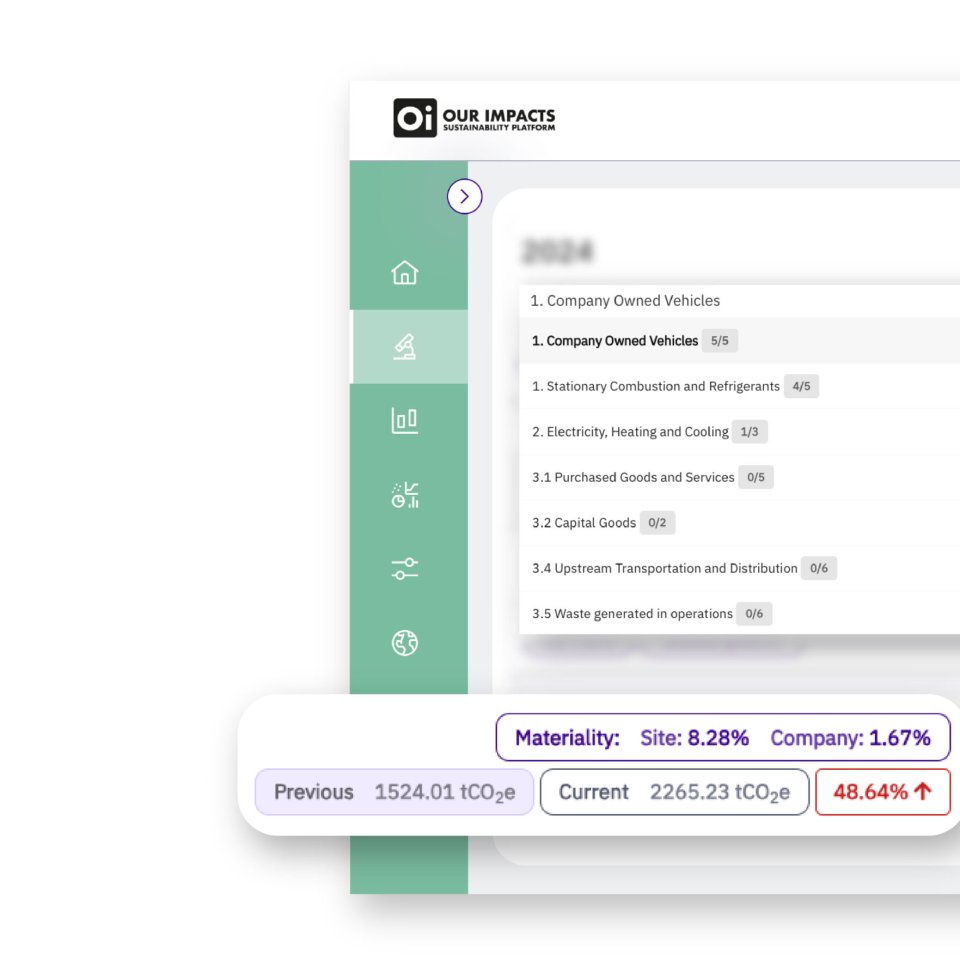
With Our Impacts Sustainability Platform, you get access to over 120,000 emission factors from around the world. The platform automatically selects the correct emission factor based on geography and time period, which allows you to focus more on collecting the correct underlying data.
To simplify reporting, the platform is built to handle different units – whether it's kilos, tons, pounds, SEK, USD, or something else.
Engage the entire organization
With an unlimited number of data providers and five flexible permission levels, you can distribute responsibility and access. This enables, for example, subsidiaries, departments, or individual users to have tailored access to specific data, facilitating internal collaboration. Auditors can also easily get their own logins for more efficient auditing.

Tailored structure
Create a reporting structure that allows you to categorize and compare emissions across different parts of your business. Break down emissions to group level, regional level, business areas, or individual offices for a clear overview. The options are vast and can be adapted to your needs.
Key figures and KPIs reflect your business's unique metrics, such as the number of products sold, the number of employees, or turnover. Emissions are distributed across underlying entities, or according to your wishes.
Historical traceability and long-term perspective
In Our Impacts, you always have access to historical data, with real-time emissions visualizations. Attach files, comment directly in the tool, and explain estimates in a transparent way. For large amounts of data, it is possible to easily upload via Excel templates or customized APIs to streamline the process.
Our Impacts - Client Cases
Read more about how some of our customers have worked with Our Impacts for their climate calculations


Frequently asked questions
Climate Calculations
-
What should be included in a climate calculation?
It depends on a number of factors and varies from case to case, such as the company's ambition, stakeholder requirements, legal requirements (CSRD, EU taxonomy), industry practice, and risks and transparency.
-
What is a company's carbon footprint?
A company's carbon footprint is a measure of the total greenhouse gas emissions that are directly and indirectly linked to its operations, expressed as carbon dioxide equivalents (CO2e). It reflects the impact a company has on the environment in terms of climate change, considering all activities from production to distribution and beyond.
-
Do all emissions need to be calculated?
Ideally, yes, but the important thing is to focus on the largest sources of emissions and to be transparent, both in the methodology and in your external communication. You never want to mislead, hide, or in any way embellish your actual emissions in your communication.
-
What is the difference between activity-based and spend-based data?
- Activity-based data is based on actual activities, such as number of passenger kilometers, products, kg, or liters.
- Spend-based data is based on standard emissions that are based on currency spent (or other currency).
ZeroMission always recommends using activity-based data first and foremost, as expenditure-based data provides greater uncertainty with difficult-to-interpret results.
We illustrate with an example:
- A product made of recycled material is very likely more expensive than a product made of virgin material. This means that the more expensive product will have a higher climate impact than the cheaper one if you use the spend-based method.
- According to this method, the effect is the opposite and creates incentives to buy pens made of virgin material instead of recycled.
- Another example is that spend-based figures are not adjusted for inflation or take into account different purchase prices.
-
What are the biggest sources of emissions?
It varies greatly depending on the business and sector. Below are some examples of major emission sources per sector (in no particular order).
- Transport companies: company-owned vehicles, fuel combustion, and capital goods.
- Retail: purchase of products, electricity consumption, guest commuting.
- Manufacturing companies: raw materials, electricity consumption, transport.
- Event companies: purchase of products, transport, electricity consumption, commuting.
- IT companies: use of sold products, purchase of goods, electricity consumption, transport.
-
What happens with the result of a climate calculation?
Once the climate calculation or inventory is completed, all customers are offered a simple analysis of the results. This analysis also includes suggestions for improvement for future years' climate calculations or assessments. The analysis should correspond to the customer's needs, ambition and level of development.
Where appropriate, an in-depth analysis with an associated workshop can also be offered, focusing on how the business can reduce emissions in line with a target scenario.
From here, companies must take over. It is you, together with us, who are captains of spaceship Earth. Bring commitment into the company, make climate a natural part of your business, and create change.
-
What frameworks and tools does ZeroMission use?
We use an ESG tool called Our Impacts Sustainability Platform, created by our partner Ecoonline. The climate module of the tool is based on the GHG protocol, and CSRD is based on the ESRS standard.
-
What types of industries does ZeroMission work with?
We work with various sectors, including energy, transport, manufacturing and agriculture, and tailor our services to meet industry-specific needs.
-
How accurate does a calculation need to be?
It depends entirely on the purpose of the calculation. For example, if you want to do a quick mapping to understand what your major emissions are, a general calculation may suffice. However, keep in mind that these calculations make it difficult to compare year to year, quickly become outdated, and irrelevant when you want to analyze how your choices during a year have affected your emissions.
Therefore, identify the basis for your calculation and then decide on the level you want to aim for.
At ZeroMission, we work on climate issues because we want to make a difference. Don't forget that this is also why we all calculate our emissions - to make a difference. A calculation without a baseline risks not leading to any action.
It is therefore important that the calculations systematically neither underestimate nor overestimate emissions, but are as close to reality as possible.
-
What is CBAM?
The Carbon Border Adjustment Mechanism (CBAM) is an EU initiative designed to address carbon leakage and promote fair competition in global trade. It aims to introduce a carbon price on certain imported goods from countries with less stringent climate regulations, ensuring that manufacturers within the EU are not disadvantaged by higher environmental standards. Under CBAM, importers will need to purchase carbon certificates corresponding to the emissions associated with their products. The mechanism covers sectors with a high risk of carbon leakage, such as steel, cement, and fertilizers, and aims to encourage foreign producers to adopt more sustainable practices. Ultimately, the goal of CBAM is to support the EU's climate goals while maintaining fair competition for European companies in the transition to a low-carbon economy.
Greenhouse Gas Protocol
-
What is the Greenhouse Gas Protocol (GHG Protocol)?
The GHG Protocol is an internationally recognized standard for calculating the climate impact of organizations and operations. According to the standard, emissions are categorized as follows:
Scope 1: Direct emissions
- Emissions from stationary combustion sources (e.g., boilers, diesel generators)
- Emissions from mobile combustion sources (e.g., company-owned vehicles)
- Emissions from leaking refrigerants (e.g., from cooling systems and air conditioning)
Scope 2: Indirect emissions from purchased energy
- Emissions from electricity consumption
- Emissions from district heating or district cooling
Scope 3: Indirect emissions
- 3.1 Purchased goods and services
- 3.2 Capital goods (e.g., machinery and buildings)
- 3.3 Upstream emissions of Scope 1 and 2
- 3.4 Transportation and distribution (upstream)
- 3.5 Waste from operations
- 3.6 Business travel
- 3.7 Employee commuting
- 3.8 Leased assets (upstream)
- 3.9 Transportation and distribution (downstream)
- 3.10 Processing of sold products
- 3.11 Use of sold products
- 3.12 End-of-life treatment of sold products (waste disposal)
- 3.13 Leased assets (downstream)
- 3.14 Franchise operations
- 3.15 Investments
-
According to the GHG Protocol, what should you include in your climate calculation?
What you are affected by determines the scope of the climate calculation. For a full-scale calculation, all emissions within the Greenhouse Gas Protocol's three scopes must be included. The selected system boundary reflects the business's emission sources and what is relevant to you.
-
How are Scope 1, 2, and 3 connected?
Scope 3 emissions can largely be seen as another organization's Scope 1 and 2. This means that Scope 3 is often double-counted.
Let's take an example:
- Company A buys PET granules to manufacture plastic bottles. For them, this is a Scope 3 emission (category 3.1: purchase of goods).
- Trading company B then buys the finished plastic bottles from Company A. For them, this is also a Scope 3 emission (category 3.1: purchase of goods).
-
Why is Scope 3 reported then, if it leads to double counting?
Because it helps us understand that all activities at some stage contribute to emissions. Scope 3 highlights all emissions created in a business's value chain – from production to consumption. If companies did not report their Scope 3 emissions, we risk some emissions disappearing blindly, even though they have a major impact on the climate.
-
How should we proceed to calculate our Scope 3 emissions?
The first step is to identify the largest emission sources in Scope 3. A good question to ask is: which parts of Scope 3 have the best synergies and overlap with other priorities in the business? And how should you communicate your measures so that they have an impact on your consumers and suppliers?
For example, for an electronics company, reducing the carbon footprint of its products can appeal to consumer groups, provide a competitive advantage, increase investor interest and give stakeholders more confidence in the company's emission reduction targets.
-
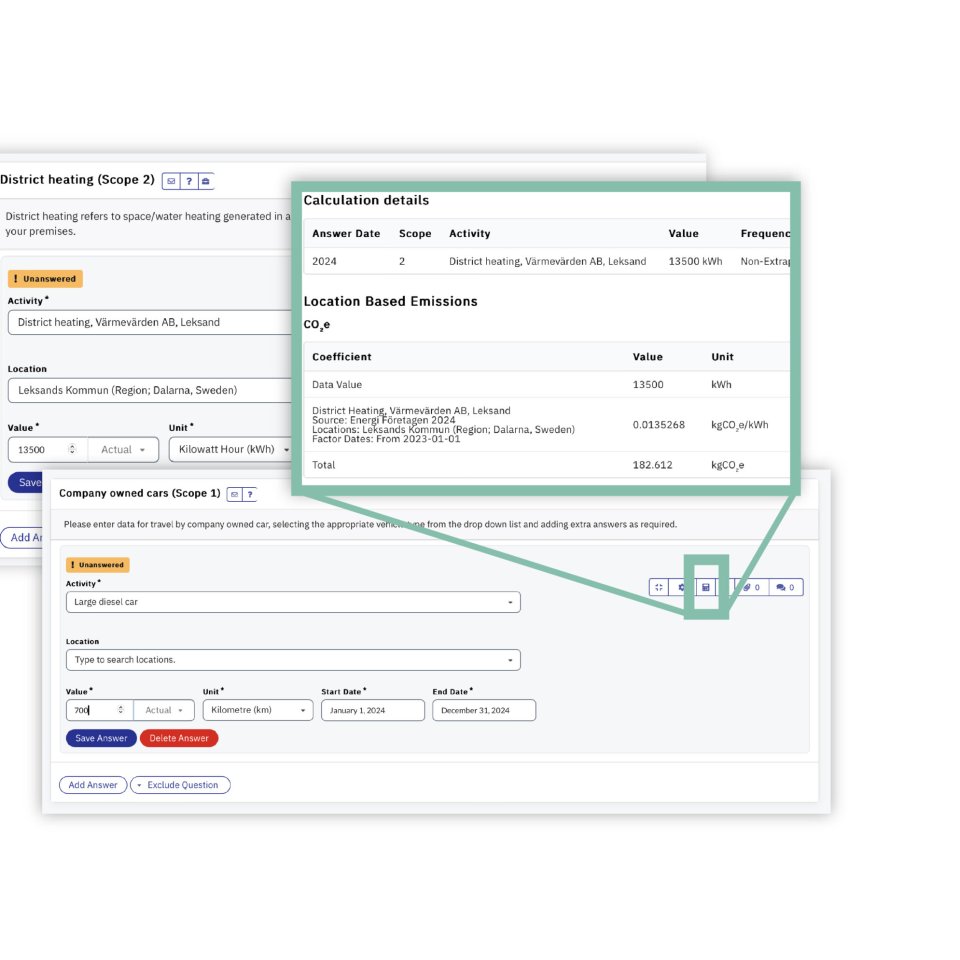
What do "market based" and "location based" mean?
Reporting of emissions in Scope 2 involves two main methods: location-based and market-based calculations.
- For location-based calculations, emissions are calculated based on the average emission level of the electricity network in a specific geographical area, regardless of where the electricity is purchased. This method reflects the emissions associated with the local energy mix used to generate electricity.
- For market-based calculations, emissions are accounted for based on the specific energy mixes purchased, including renewable energy certificates (RECs).
Companies can choose to report according to both methods to get a comprehensive picture of their emissions and show how their energy choices affect emissions.
Location-based reporting often results in higher emissions in regions that are dependent on fossil fuels, while market-based reporting can show lower emissions when companies actively invest in renewable energy sources.
Articles related to climate calculations
-

April 30, 2026
LSRS – What the Land Sector and Removal Standard Means for Your Business
Read more -

December 4, 2025
Calculate emissions from aviation – reliable climate calculations for businesses
Read more -
June 16, 2025
Science Based Targets or Exponential Roadmap: which is right for you?
Read more
Other services


We help you pick up the pace
Contact us for an informal meeting on how to calculate, reduce or take responsibility for your emissions through the purchase of carbon credits.
Latest News
Sign up for our newsletter.